Antenna Matching
Hitting the target band with minmal power loss
The two key performance targets
Antenna Matching Curves
You want your antenna to do two things well: resonate correctly and be efficient whilst doing so. If one or both of these areas is not correctly designed your device may have a short range and battery life, or possibly not be able to communicate at all:
Resonance frequencies
The design goal is to have one or more resonance frequencies in the middle of the target bands for the radio standard you plan to use for your device;
Minimal power loss
The second goal to radiate power in that band as efficiently as possible and eliminate unnecessary power losses. Power is lost from a combination of factors including:
- reflections inside the PCB caused by impedance mismatches
- heat from interaction between the transmission lines and the dielectric of component of the PCB, enclosure and connecting wires.
VSWR
VSWR (Voltage Standing Wave Ratio) expresses the efficiency of transfer of power to an antenna which is negatively affected by an impedance mismatch. The reflection coefficient of the power reflected back from the antenna due to this mismatch is called the Return Loss and is expressed in -dB (the higher the negative value the better). A VSWR less than 3 is considered satisfactory for a cellular radio, and at 2 or better there is little to gain from impedance matching. As VSWR increases the transmit power of the radio module decreases and bit errors can occur, worse, the reflected power can damage the radio.
- VSWR: 2 = Return Loss of -9.5 dB approximated to -10dB
- VSWR: 3 = Return Loss of -6 dB
Resonance Frequency Bandwidth
The frequency gap between two – 6 dB or – 9.5 dB points in the curve on the resonance frequency is called the -6 dB or -10 dB bandwidth. A -10 dB bandwidth (equal to a VSWR of 2) covering the target resonance frequency is the goal of any antenna designer.
Putting it together
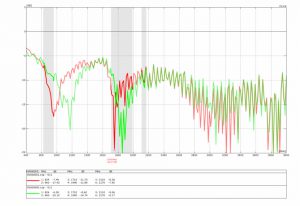
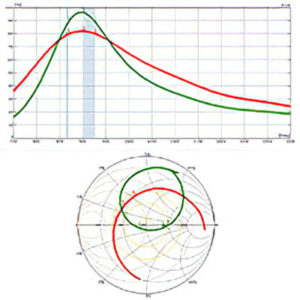
return loss curves from a VNA used to tune the antenna for optimal performance
In the example above the green graph shows that the -10 dB Return Loss bandwidth is from an estimated 1000 MHz up to 1250 MHz whereas across the target resonance frequency shaded in grey it is below the -10 dB target, and thus the antenna must be adjusted. With the adjustment the red graph shows that the antenna now performs more or less satisfactorily at both target bands (in this case GSM 900 and 1800).
Trust the experts. How akorIoT can help
The akorIoT team has extensive experience in the tuning of antennas in real-life application situations, typically delivery several dBm of improved performance that leads to lower in-field costs through greater transmission range and longer battery life.
The team offer a range of services to help you get the best possible performance from an antenna, contact us today find out how we can help.